Where the hell’s the volatility? A retro look at June 2024 in ERCOT
It’s said that hindsight is 20/20, so with our newly perfected vision let’s reflect on the past month and get to the bottom of why we haven’t seen the same kind of price movements as 2023.
Key Takeaways:
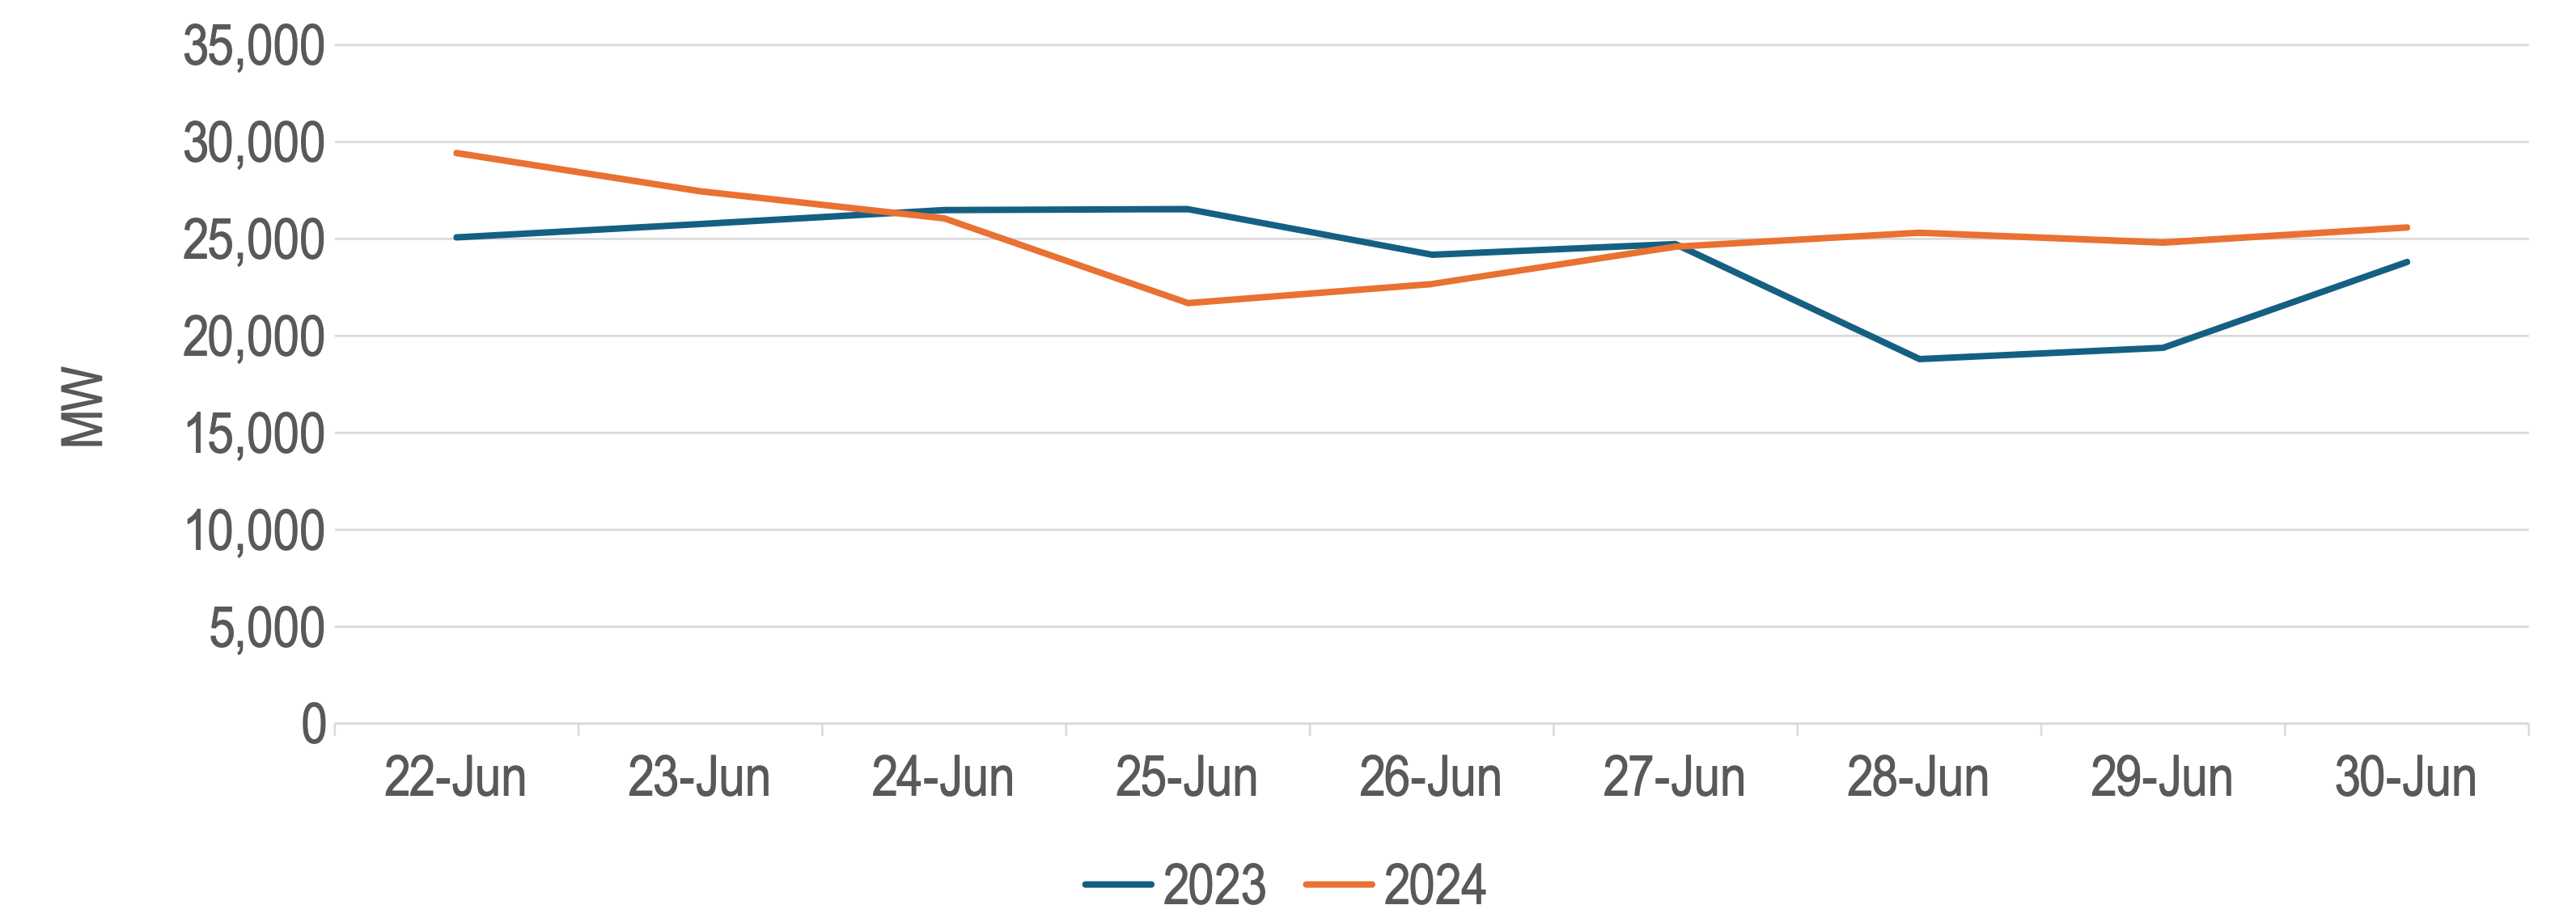
- Fewer price movements in ERCOT even with higher electricity demand (+4% vs. last year with a peak of 80.1 GWh on June 27).
- High prices in Texas are no longer driven purely by hot weather/high load. Load is up +4% but net load is actually down -5% vs. last year.
- Wind and solar generation in Texas is up a whopping +28% vs. 2023
- Buckle up…volatility incoming in July/August 2024
RENEWABLES ARE REDUCING VOLATILITY?? 😭
Let’s compare 2024 vs. last year:
Fig 1: Max Daily Real-Time Price in ERCOT, June 2023 vs. 2024
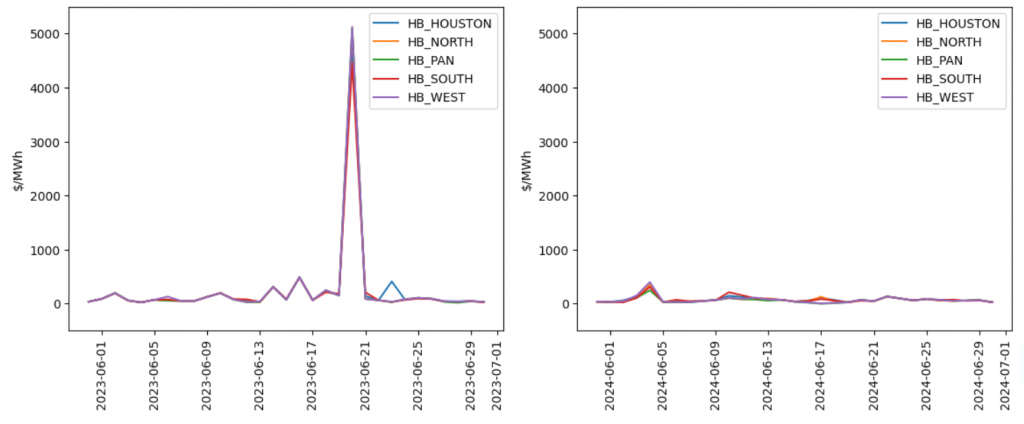
Source: ERCOT, Gaiascope
Fig 2: Load, Wind, Solar, Net Load, June 2023 vs. 2024
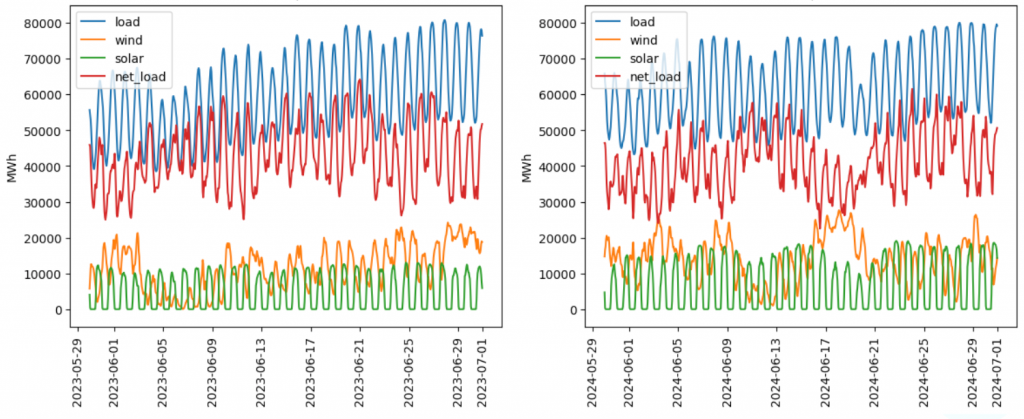
Source: ERCOT, Gaiascope
First, it’s important to note that high prices in Texas are no longer driven purely by hot weather/high load (where higher load = higher prices), as we’re no longer in a world where natural gas power plants rule, electricity prices matching neatly against nat gas bid curves, with higher load driving a well-organized ramp of sequentially more expensive suppliers, each with a higher start-up/operational cost than the last, who in orderly fashion fire up their gas turbines to meet load. No… it’s a net load game now: net load meaning load minus “non-dispatchable” generation, i.e. generation without fuel cost and with minimal start-up/operational cost: hello wind and solar! If the wind is blowing and the sun is shining, in general these plants are outputting every darn MW they can muster, and ta da, load is reduced by their supply.
Second, wind and solar generation in Texas is up a whopping +28% vs. 2023 🤯: that’s +4.8 GW per hour on average.
All this is to say: load is up +4% but net load is actually down -5% vs. last year.
Fig 3: Cumulative Load, Wind, Solar, Net Load, June 2023 vs. 2024
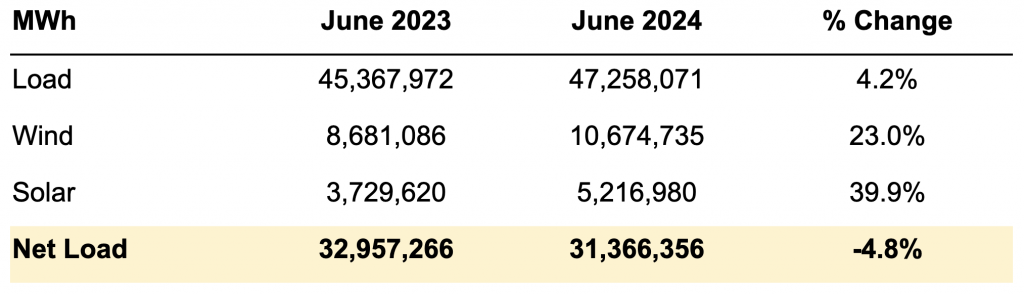
Source: ERCOT, Gaiascope
OUTAGES DIDN’T MATTER SO MUCH
Another signal often looked at for explaining price volatility is aggregate generation offline, especially when said outages are unplanned – it stands to reason that if more generation is out and the supply stack of expected, available generation is reduced, there are more opportunities for tightness between supply and demand and therefore higher prices. Interestingly, unplanned outages in June 2024 were generally similar or higher than 2023 (the last week of June was +6% higher)… highlighting even more clearly the impact of increased wind/solar generation and net load.
Fig 4: Unplanned Outages in Texas, June 2023 vs. 2024
Source: ERCOT, Gaiascope
CONGESTION REVERSED IN SOUTH TEXAS?
Last year in June 2023, we made a bunch of money off of congestion in South Texas. This was driven primarily by a constraint called PAWNEE_SPRUCE1_1, which was in turn driven by a pretty predictable dynamic: lots of wind generation in South Texas was isolated behind overloaded transmission lines, and these windy MWs couldn’t go anywhere… so while on 6/20/2023 the Texas grid rode a rocket ship to the moon of $5,000/MW prices, many nodal prices in South Texas stayed low, on the order of thousands of $ per MW. We forecasted this price differential and profited.
Fast forward to June 2024, and South Texas has some new transmission lines making their way into service, which many hypothesize has alleviated regional congestion. June 2024 seems to support this hypothesis with prices consistently higher in the south and high price shocks occurring in South Texas in both May and July; note there is some chance, however, that depressed prices reappear in high net load/high wind situations (more on the potential for high net load next).
Fig 5: Congestion Impact: Price Differentials Between Regions, June 2023 vs. 2024
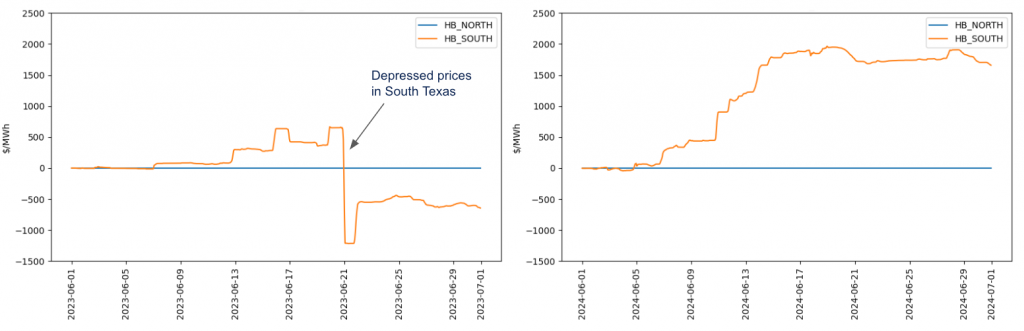
Source: ERCOT, Gaiascope
DON’T GET TOO COMFORTABLE… VOLATILITY IS COMING
La Niña is arriving… probably in July. This means higher risk of drought, which would exacerbate heat waves without sufficient soil moisture to evaporate and help cool things down (as anyone living in Comal County over the summer of 2023 will attest). Also, a jetstream moving northward could mean less wind in Texas. Note that July and August historically have exhibited the highest load and lowest wind speed/output of any months in the state.
Fig 6: Wind Speed in Texas
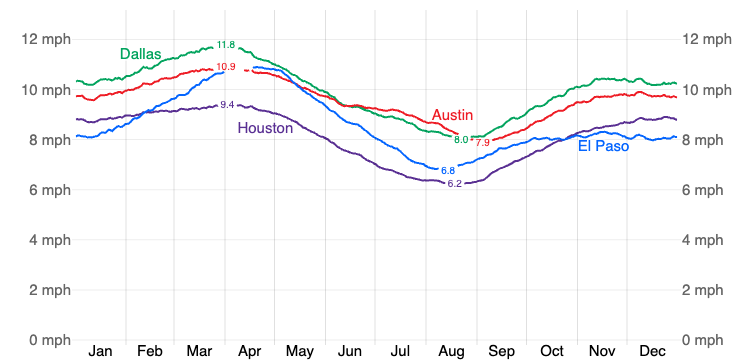
Source: © WeatherSpark.com
Are you prepared for the coming months? How are you managing price risk for your renewable assets in ERCOT? At Gaiascope, we leverage our Terra Platform and market knowledge to manage downside risk without compromising revenue creation through trading. And we’re here for you when you need it: gaia@gaia-scope.com.