
SUMMER 2024 WILL BE MORE VOLATILE THAN ERCOT THINKS
MITIGATE YOUR RISKS WITH SUPERIOR FORECASTING AND MARKET STRATEGY
SUMMARY:
In its January report, ERCOT announced that summer peak load and volatility in 2024 will both be lower than in 2023. Gaiascope strongly disagrees with this assessment: market participants that are expecting a less volatile summer are underestimating their exposure and potential for significant financial gains and losses if they take ERCOT’s views at face value. Leveraging our Terra Platform and the experience of our expert traders we will break down the reasons why.
In this post we discuss:
- Why ERCOT’s Assumptions Are Flawed
- The Importance of Accurate Net Load Forecasting
- The Impacts of Solar and Wind Growth
- How to Prepare For Summer 2024 Price Volatility
In short, we expect another wild price ride this summer. Relying on ERCOT’s forecasts alone will be costly; the rapidly changing ERCOT landscape requires greater attention than ever before to forecasting for price, congestion, load, and generation. The good news is Gaiascope is prepared (dare we say…excited?) to help you navigate and capitalize on this volatility.
If you have a renewable energy asset in ERCOT, we can help you reduce your risk and improve your profits. Don’t wait until you lose your shirt…connect with our team to get onboarded before summer!
ERCOT’S PROJECTIONS:
Before we dive in, a bit of context. ERCOT released its summer load forecasts in its January 11, 2024 report: 2024 ERCOT System Planning Long-Term Hourly Peak Demand and Energy Forecast.
Figure 1: ERCOT Summer Peak Demand Forecast
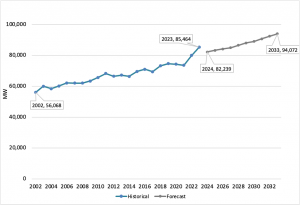
Source: ERCOT.
In its report, ERCOT states that “the forecast using historical factors from 2008 was deemed the ERCOT official forecast” for 2024 because “it is very difficult to determine how weather conditions will align or not at the time of ERCOT’s summer peak” and “using the 2008 historical factors resulted in the least amount of diversity between weather zone demand and ERCOT-wide demand at the time of ERCOT’s summer peak.”
In other words, ERCOT backed into its weather assumptions rather than make a call on what weather will actually be this summer.
WHY ERCOT’S ASSUMPTIONS ARE FLAWED:
Any forecast is only as good as the quality of the input data and assumptions. Some of ERCOT’s assumptions are flawed and led to lower load projections than will occur.
To illustrate this, we highlight ERCOT’s use of 2008 weather to forecast the timing of peak load hours for this summer, purely because the 2008 weather data presented the least variability in load between weather zones. 2008 is far out of date with shifting weather patterns and is an even worse assumption than averaging across the past 15 years. And both of these methods ignore actual climate trends. Relying on 15 year-old weather data to predict weather and load behavior for this summer is like a marathon runner wearing their favorite pair of racing shoes from a decade ago, ignoring the fact that the soles are dilapidated and may lead to injury.
It is well-recognized that climate change is systematically shifting weather distributions. These trends include higher mean temperatures and higher frequency of extreme temperature spikes, both of which drive up energy use.
Studies completed by Climate Central found that Houston’s average summertime temperature increased by 4.2°F from 1970-2022, and that Houston’s frequency of summer extreme temperature days increased by 53 days over the same period.
Figure 2: Climate trends – Houston average summer temperatures have risen 4.2 degrees and are still rising

Source: Climate Central (read more here).
Figure 3: Climate trends – Houston extreme summer temperatures are becoming more frequent

Source: Climate Central (read more here).
Additional information on Houston’s weather trends can also be found here. If you want an idea of how much hotter 2023 was vs. 2008, just look at the graphs below, noting how the dark blue bars (actual high and low temperatures) have shifted up and set four new record highs in the 2023 graph:
Figure 4: Houston climate trends – observed temperatures (blue bars) in July 2023 consistently hovered near 100 degrees and set four record highs, while temperatures in July 2008 rarely exceeded 95 degrees
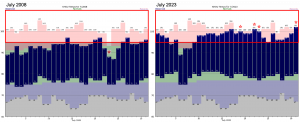
Source: weather.gov.
These trends are not unique to Houston. Other major load hubs (i.e. cities) across Texas, as well as Texas as a whole, are hotter on average and are experiencing a higher frequency of extreme heat days.1, 2
ERCOT fails to account for these recognized and crucial climate factors in its methodology by relying on historical averages, the error of which is exacerbated by its reliance on weather data from 2008 to forecast summer peak load hours. As a result, ERCOT is under-representing high temperature risks and ultimately under-forecasting this summer’s peak load risks.
It doesn’t help ERCOT’s case that in its equivalent peak demand and energy forecast report last year, ERCOT under-forecasted 2023 peak load over summer months by 3.2 – 8.6 GW (+4% to +11% vs. forecasted monthly peaks).3, 4
THE IMPORTANCE OF ACCURATE NET LOAD FORECASTING:
While load is a crucial driver of pricing, renewables have also become essential for predicting price spikes. Asset owners must think beyond just load and peak load. When developing expectations for price spikes and volatility, net load (load minus wind and solar production) is a greater indicator of extreme RTM pricing than load alone. And the uncertainty around net load is growing as a result of more renewable energy generation.
Figure 5: Net load is a better indicator of RTM price spikes than just load
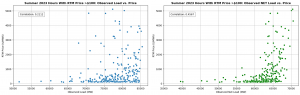
Source: ERCOT observed load, solar and wind generation, and RTM price data for Jun-Sep 2023.
The charts above show hub Houston’s RTM price and associated load (left) and net load (right) for hours last summer where the RTM price exceeded $100. The tighter clustering of points in the net load graph above indicates net load is a stronger indicator of high RTM prices than load. This is also shown in the graphs by the correlation values: 0.46 between net load and high RTM prices, compared to only 0.21 for load and high RTM prices.
Since net load is more important for RTM price spikes than load alone, that means that both the magnitude and timing of both load and renewable generation matter.
In other words, asset owners need more than just peak load and generation forecasts every day – they need accurate hour-by-hour forecasting for grid-wide load and renewable generation. Is net load expected to be low tomorrow, while your generation is expected to be high? This may drive congestion up at your node in real-time, meaning you may want to hedge your congestion risks in the day-ahead market. This is just one example of many legitimate risks for renewable asset owners that hinge on forecasting accuracy (and net load is just part of the story for navigating these risks).
Gaiascope’s Terra Platform handles the heavy lift of forecasting these hourly net load dynamics, as well as many other key drivers of nodal prices. Terra also recommends a personalized day-ahead bidding strategy, so that asset owners can mitigate their unique hourly risks.
THE IMPACTS OF SOLAR AND WIND GROWTH:
To recap:
- we expect higher peak load than ERCOT this summer, and
- net load levels (rather than load alone) drive pricing.
Now the question begs: won’t new renewable capacity reduce peak net load, and consequently reduce volatility? We argue that it will not, illustrating how the recent solar growth in ERCOT impacts our net load expectations.
For context, solar capacity this summer is expected to be 1.42x what it was in 2023 according to ERCOT’s resource adequacy reports. Since wind capacity has stayed relatively constant (38GW in May 2023 vs. 39GW in May 2024), we anticipate the effect of wind generation changes on net load to be minimal and focus this section on solar.
To assess the impact of this solar growth on net load, we compared last year’s observed net load to what it would have looked like assuming 1.42x more solar generation. What we find (perhaps unsurprisingly to any Californians reading this) is that net load significantly decreases on average, except for the hours where observed peak net load is the highest. For these peak net load hours, the dampening effect of increased solar generation is minimal (see table below).
Figure 6: New solar generation in ERCOT dampens summer net load, except in peak hours.

Source: Simulation created using ERCOT observed load, solar generation, and wind generation data for Jun-Sep 2023.
With peak values remaining high and low values being pushed lower, that means the tails of our daily net load distribution are getting fatter. The same concept is shown in the hourly comparison below for August 2023.
Figure 7: August 2023 illustration of how new solar generation in ERCOT dampens hourly net load, except in peak hours
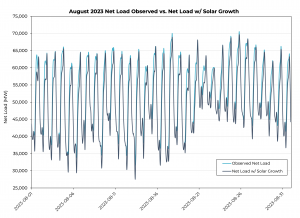

Source: Simulation created using ERCOT observed load, solar generation, and wind generation data for Jun-Sep 2023.
HOW TO PREPARE FOR SUMMER 2024 PRICE VOLATILITY:
This leaves us with a couple of key summary points around price volatility this summer:
- 1) We should anticipate high peak load (definitely higher than ERCOT expects)
- 2) We should anticipate high peak net load, despite the growth in renewable generation in ERCOT
This means larger daily swings in net load (lower lows, but still high highs). Finally, given net load’s impact on RTM prices, this means we should also anticipate wide price spreads (i.e., volatility) this summer. Buckle up!
Gaiascope rigorously monitors and models renewable generation, load, net load, ramp hours, congestion, and much more as part of our optimization solution for renewable energy assets. We are still onboarding renewable energy clients for this summer. Reach out to learn how Gaiascope can help you safely navigate and capitalize on this changing market landscape.
ABOUT GAIASCOPE:
Gaiascope is dedicated to maintaining planetary balance, and we know the best way to drive investment in sustainable energy assets is to make those assets as profitable as possible. For every $1 million invested in a sustainable energy asset instead of fossil fuels, that’s 2 million metric tonnes of annual CO2 avoided. We do our part by providing clients the best possible tool to optimize returns of their wind, solar and storage assets.
To learn more about Gaiascope or to contact us with any inquiries or requests: contact Gaia.