Making Decisions with Gaiascope Forecasts
There are three primary price drivers of energy spot markets in ERCOT: system lambda, price adders and congestion. At Gaiascope, we look at the drivers of each to create a comprehensive view and calculate the probability of key price movements.
Presented below is an example display for this type of analysis, highlighting the probability of prices greater than $100/MWh. The analysis is provided for a specific resource node (LAPETUS_U1) and looks at prices for the following day. In other words, these forecasts were created prior to the close of the day-ahead market on 6/13/2021 for operating day 6/14/2021 .
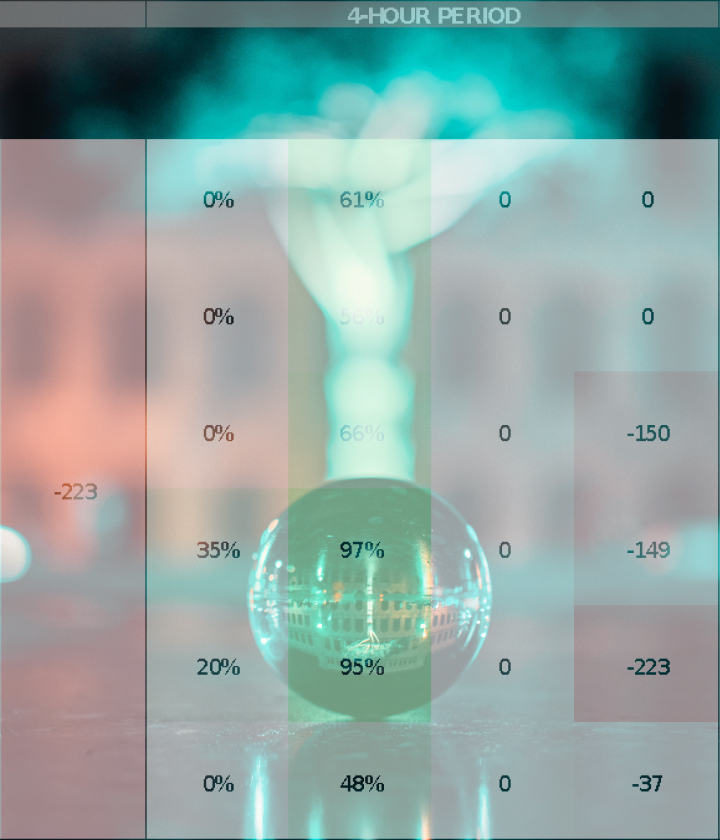
FIG 1: NEXT DAY FORECAST: LAPETUS UNIT 1 RESOURCE NODE, 6/14/2021

Fig 1: Next-day forecasted probability of prices > $100/MWh with various time resolutions, from daily down to hourly. For instance, the 97% probability for system lambda in hours 13-16 indicates there is a 97% chance that one hour within the 4 hour block will see a system lambda price greater than $100/MWh. In addition, the min and max expected congestion price for each period is shown. The red and green shading highlights periods of greatest expected upside and downside to prices.
Note that while we forecast prices for each hour, it is often valuable to look at probabilities over longer periods of time. For example, we see that on 6/14/2021 we projected a 100% probability of a system lambda price spike (price spike defined as > $100/MWh) at some point during the day, and a ~50% chance of a price adder. We also look at probabilities over 4-hour time blocks, showing that hours 13-16 and 17-20 present the highest probability of high prices driven by system lambda and price adders. This is somewhat offset by the risk of negative pressure on pricing at this specific location driven by congestion, with this risk highest during hours 17-20.
So how to make decisions using this data? As an example, an energy storage asset with a 4-hour duration and 100 MW power capacity (or 400 MWh energy capacity) could be convinced the best plan is to charge during the wee hours of the night, at a low cost, then dispatch at 100% of its capacity over the 4 hours within the 13-16 hour window, given the highest probability of system lambda and price adders combined with lowest risk of congestion.
Actual prices vs. forecasts are shown below. Assuming the plan above, the storage asset would capture peak prices at this location for the day, averaging $225/MWh over the 4 hours dispatched.
FIG 2: PROJECTIONS VS. ACTUALS: LAPETUS UNIT 1 RESOURCE NODE, 6/14/2021

Fig 2: Analysis summary:
-
Price adder events occurred in real time and corresponded to forecasted hours 14-17
-
System lambda outliers occurred in real time and corresponded to forecasted hours 14-16
-
Negative prices from congestion occurred in real time and corresponded to the 13-16 and 17-20 forecasted time blocks
Shown below is the exact same analysis, but this time for a load zone (LZ_LCRA) and for a more recent day in May 2022.
FIG 3: NEXT DAY FORECAST: LOAD ZONE LCRA, 5/13/2022

Note that given the similar probability of high prices in the hour blocks 13-16 and 17-20, a storage asset exposed contractually to this load zone price, assuming a 4-hour duration and 100 MW power capacity, could be convinced to dispatch at 50% capacity over the 8 hours within the 13-20 hour window.
FIG 4: PROJECTIONS VS. ACTUALS: LOAD ZONE LCRA, 5/13/2022

Assuming the plan above, the storage asset may not perfectly capture peak prices over a 4-hour period, but it wouldn’t miss out completely either: the asset would realize a healthy $1,494/MWh average price over the 8 hours dispatched. The asset could also determine to dispatch 100% of capacity once prices reached an internal threshold or through updated forecasts and dispatch decisions, improving realizations further.
___
To learn more about Gaiascope’s capabilities, please inquire on our Contact Us page or email us at founders@gaia-scope.com.